Chamber data acquisition & compliance software

Run 25 chambers.
Pass every audit.
Know how well every run was held.

The QA report doesn’t stop at PASS. It measures the condition itself (MKT, the joint temperature / humidity window, time in tolerance) and says why when a figure can’t be calculated or is incomplete.

No chamber needed — the free trial runs a built-in virtual Watlow® F4T, with a stability chamber demo ready to start.

21 CFR Part 11 ready AMS 2750 / Nadcap Run analytics built in Up to 25 chambers
Example Manufacturing Co.
Plant 2 — Stability Storage
Stability Chamber Environmental Record
Storage condition 25 °C / 60 %RH
[SIM] Simulated data — not a qualified production record
REVIEW

Flagged for review — an excursion outside the tolerance band, on a step whose criticality does not fail the run

How this verdict is decided: FAIL if any Critical step alarmed. REVIEW if any Critical step warned, any Advisory step alarmed, a breach was withheld, the run or any judged step was not fully observed, or a judged step was never reached. PASS otherwise. Joint-window figures are measurements, not part of the verdict.

Soak Scorecard

Condition Soak (min) Joint window Longest hold T in band RH in band
25 °C / 60 %RH steps 2, 3, 4, 5, 6 load held in band 420.0 98.5 % 176.9 min 98.7 % 98.5 %
Top of a real ProcessView+ 1.40 QA report cover, from a simulated 7.5-hour stability run, rebuilt in HTML. Four of the Soak Scorecard’s ten columns are left out here.
  • 1998 GVE Inc. founded Building industrial software before most of the chambers it runs were installed.
  • 2014 ProcessView+ released In the field, in regulated environments, for over a decade.
  • 1,000+ Customers worldwide From global manufacturers to single-chamber shops and government agencies — many running whole chamber networks from one installation.

Overview

See what ProcessView+ does

A quick introduction to running, logging, and proving every test on your chamber network.

Why ProcessView+

Everything between your chambers and your auditors

Run the network, log every reading, and generate the proof — from a single screen, with no scripting and no integrators.

Compliance, built in

21 CFR Part 11 and AMS 2750 ready. Hash-chained audit trail, electronic signatures, an optional tamper-evident data-log backup, and role-based access across five roles — operator, technician, supervisor, QA reviewer, and administrator. Signing authority is granted per user, on top of whichever role they hold.

Total profile control

Edit and create temperature profiles. Download, read, start, stop, pause, and resume — one chamber or all 25 — from a single screen.

Connected to your stack

SQL Server mirroring to your enterprise database. MQTT streaming to your own broker, self-hosted or on AWS or Azure. Web and mobile dashboards. Email and SMS alerts.

Proof of every condition

Every run measured against its own condition — joint window, MKT, time in tolerance and sample coverage — beside a three-state verdict on the QA report. What gets measured

Run analytics

Not just whether it passed. How well it was held.

Every run is measured the moment it ends, and every figure goes on the QA report next to the verdict. Six questions an auditor asks, answered from the run’s own data.

Setpoint-pair dwell

Was 25 °C / 60 %RH held, both at once?

Two per-loop percentages can’t tell you. The joint window can: the share of the soak with temperature and humidity in band together.

Mean kinetic temperature

Did the product see more heat than its storage condition?

Per channel, in the channel’s own unit, over the whole run including ramps. A partial record says how partial.

Time in tolerance

How long was each channel in band, in warn, in alarm?

Measured against the bands the run started with, not today’s settings. A channel with no band scores nothing, not 100%.

Sample coverage

Was the chamber actually being watched?

Readings repeated during a communication outage are marked, left out of the time-in-tolerance and joint-window figures, and the coverage is stated beside the verdict.

Dew point & absolute humidity

How much water was really in the air?

Per IAPWS-IF97, the published international formulation, cited on the report.

AMS 2750 survey

Was every thermocouple’s soak average within class?

Per soak, with hottest, coldest, survey ΔT and the furnace class band of setpoint.

Numbers you can defend

Every number shows its working, or says why there isn’t one.

Software that fills a blank with a plausible number is the fastest way to fail an audit. When ProcessView+ can’t calculate a figure, it says why, on the report, where an auditor will read it.

A band with missing limits

No tolerance band was recorded for this channel, so there is no time in tolerance to report. This is not 100% — nothing was being judged.

Never scored as a perfect channel.

A gap in the record

25.11 °C (partial — 98.7% coverage, 4 rows missing across 1 gap)

The figure, and exactly how much of the run it covers.

A run nobody can vouch for

N/ARun status not recorded for this session

Not a failure it can’t prove, and not a pass it can’t prove either.

Proof

Not a mockup — the software running

Every screenshot below is the shipping application, and each one is here because it shows a specific thing the software does.

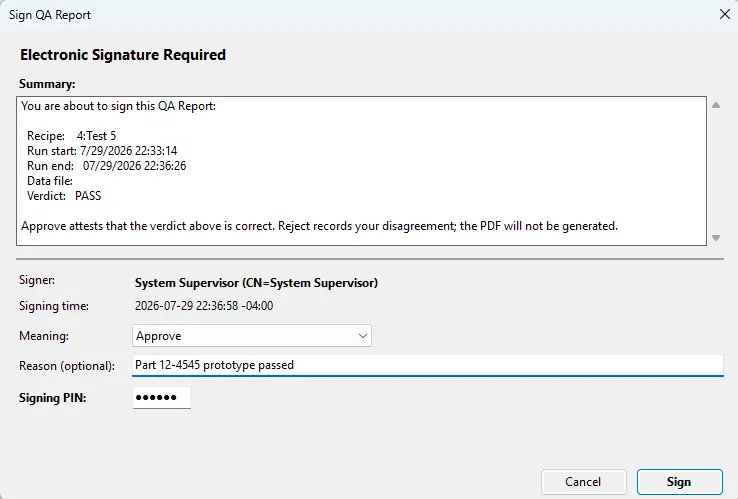
Screenshot showing that the signer sees exactly what they are attesting to.

Electronic signatures

Signed against the record, not against a screen.

The dialog states what is being signed before it will accept a PIN — recipe, run start, run end, and the verdict being attested — and records the meaning of the signature and a reason alongside it. The signature is CMS/PKCS#7 with ECDSA P-256, bound to that exact record, and the signer, meaning and UTC time go into the audit trail.

Proves the signer sees exactly what they are attesting to
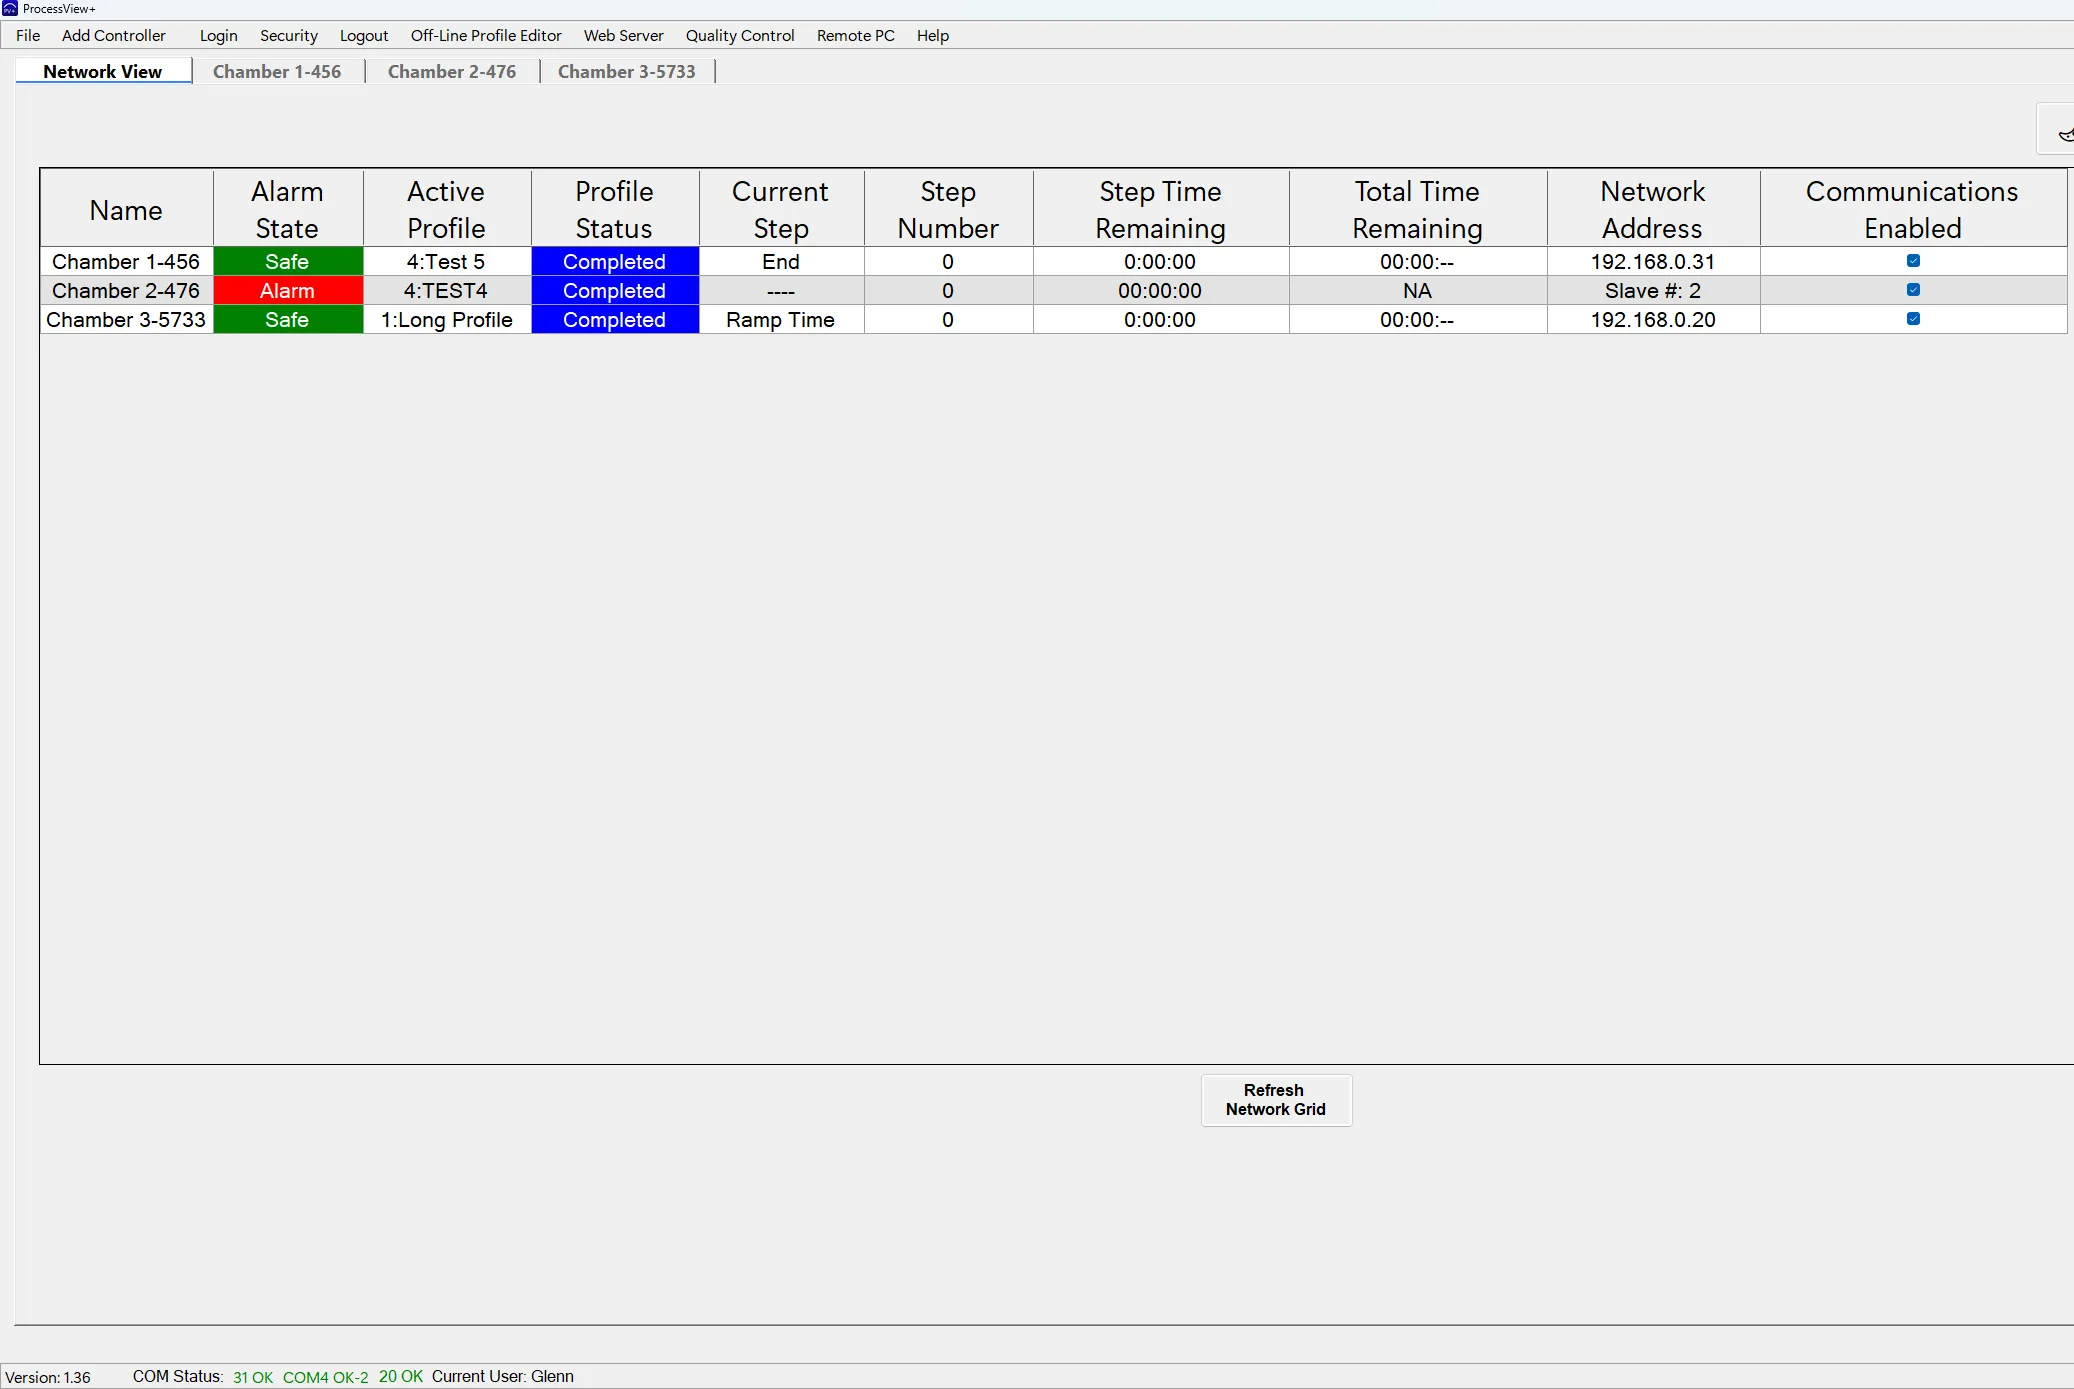
Screenshot showing that TCP and RTU chambers run side by side on one network.

Network view

Every chamber on one screen, whatever it is wired with.

Alarm state, active profile, step and time remaining for the whole network at once — and the connection column mixes freely — two of these carry an IP address and are Modbus TCP on the LAN, while "Slave #: 2" is a serial RTU node on the same screen, in the same table.

Proves TCP and RTU chambers run side by side on one network

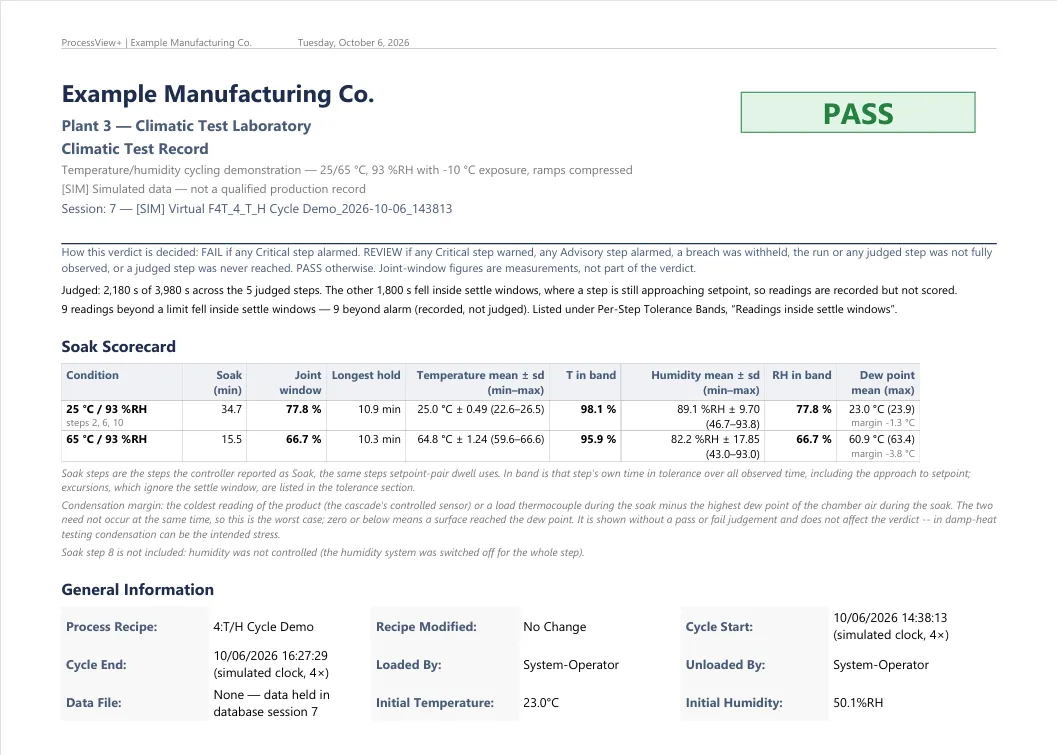
Screenshot showing that the verdict is attached to an identifiable run.

QA reports

The verdict, with the run it belongs to.

A finished run becomes a report carrying its own provenance — recipe, cycle start and end, operators, and the session it came from — with the verdict, the rule it was decided by, and a Soak Scorecard for each held condition on the cover. Example report, from simulated data.

Proves the verdict is attached to an identifiable run

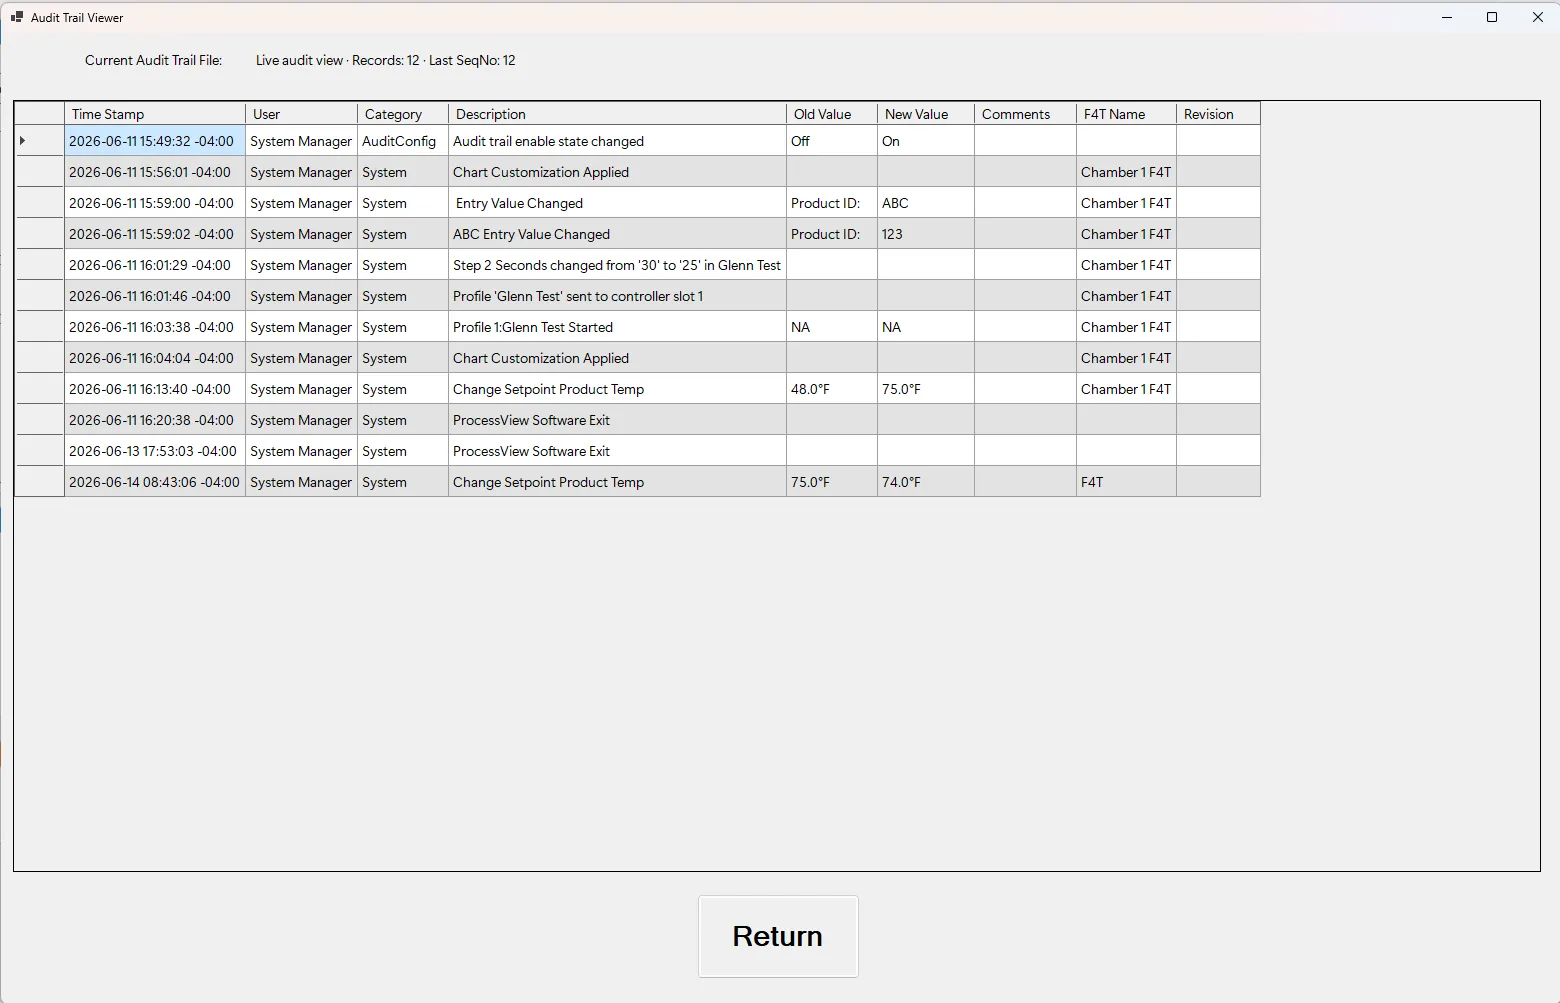
Screenshot showing that the record is attributable and tamper-evident.

Audit trail

Who changed what, when — and what it was before.

Actions taken through the application are written the moment they happen, with the old value, the new value, the user, and a UTC timestamp. Records are hash-chained to each other, so a deletion or an edit breaks the chain and is detectable.

Proves the record is attributable and tamper-evident

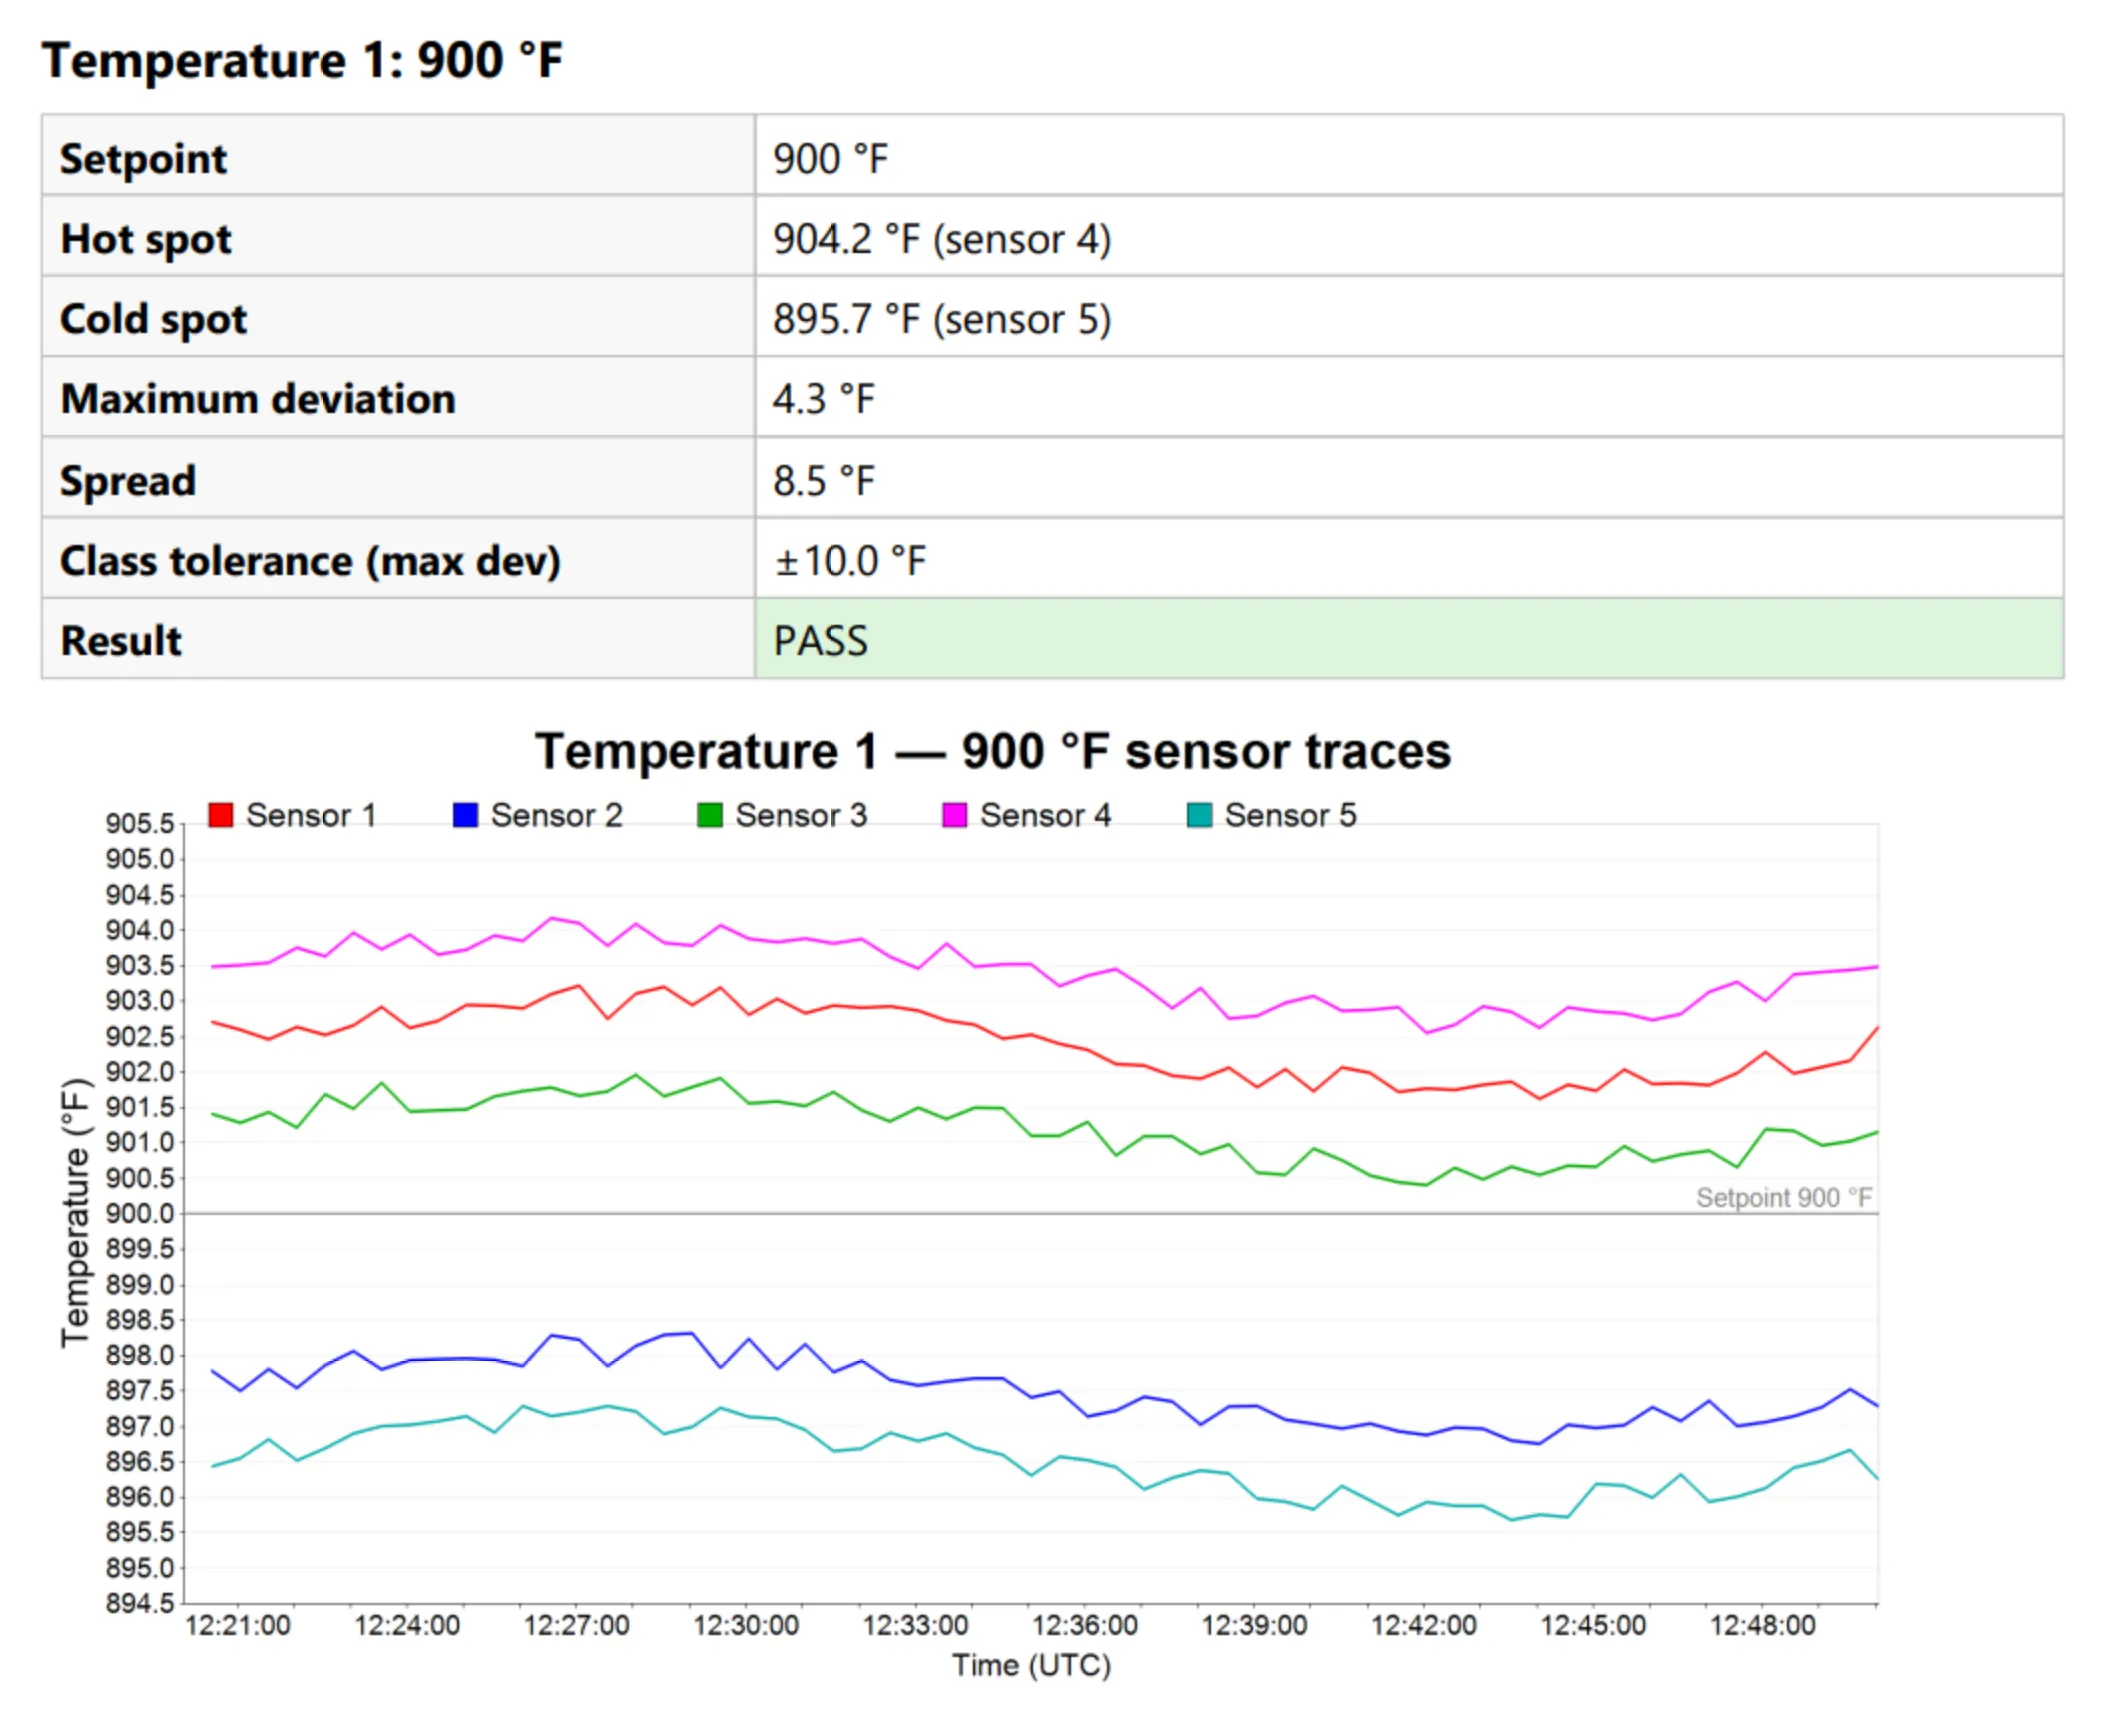
Screenshot showing that the survey is derived from the data, not transcribed.

AMS 2750

A uniformity survey, generated from the samples.

Thermal uniformity surveys are built from recorded sensor data rather than typed up afterwards — spread, maximum deviation, and hot and cold spot per sensor, with the pass/fail evaluated against the tolerance for the class. Example survey, from simulated sensor data.

Proves the survey is derived from the data, not transcribed

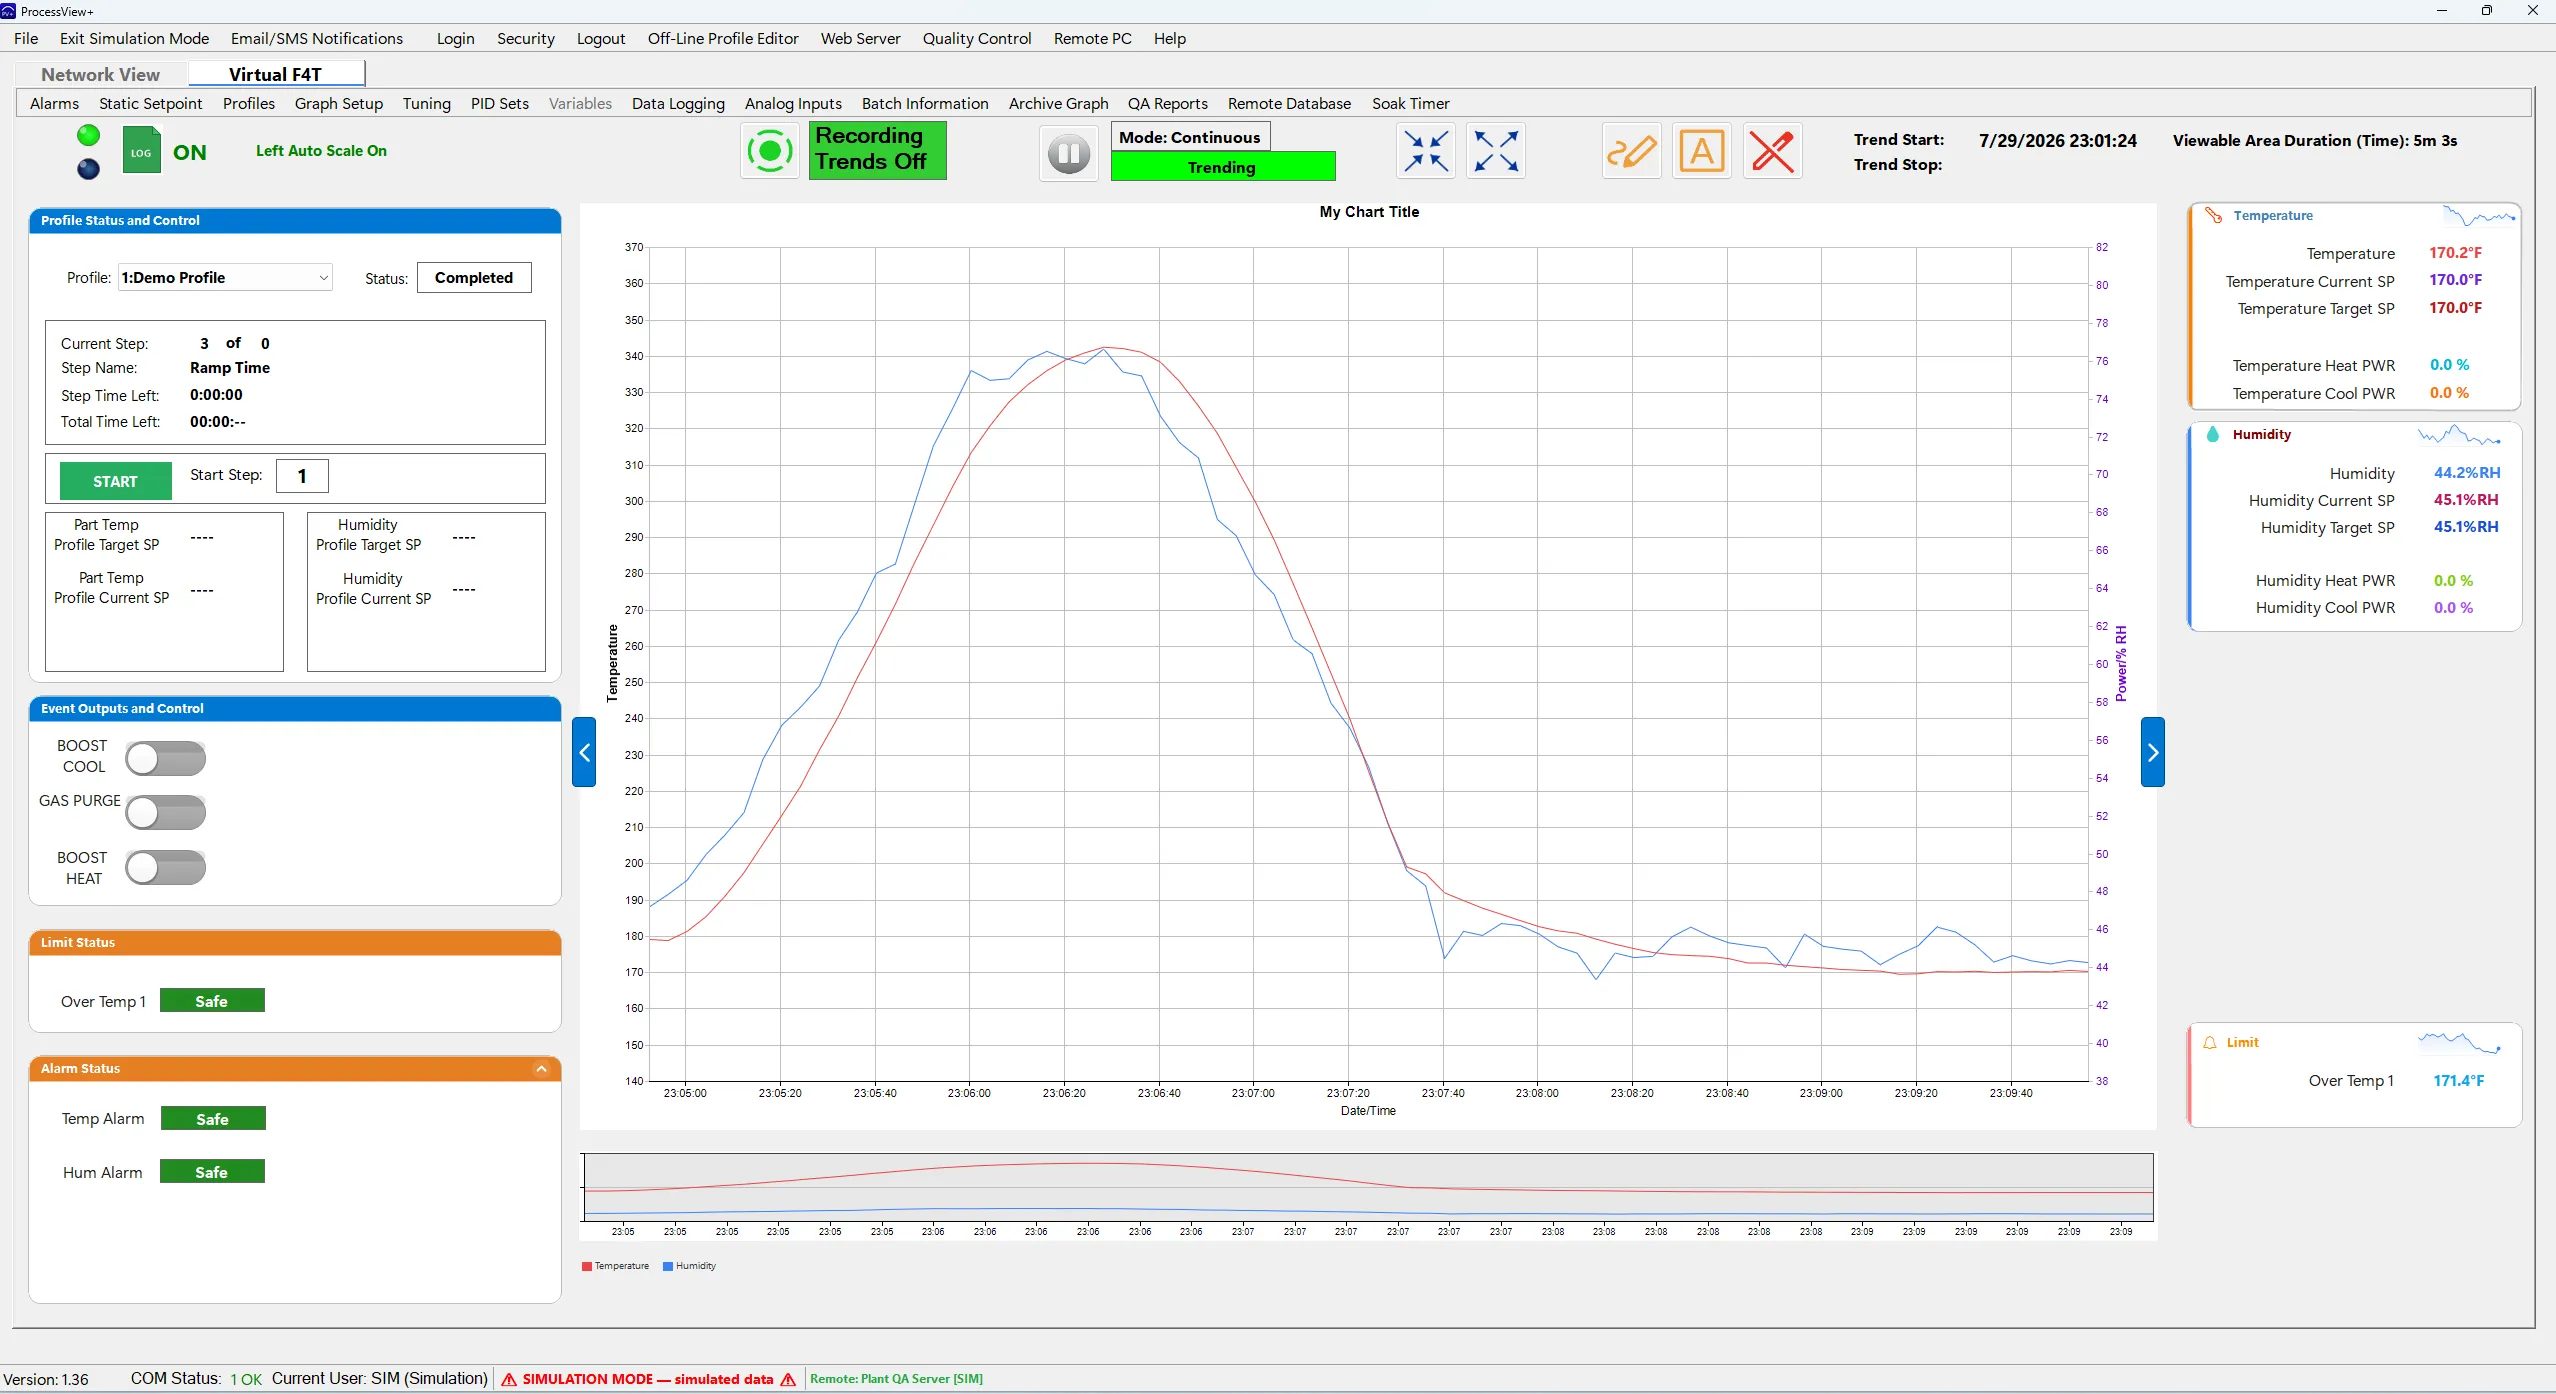
Screenshot showing that the software can be evaluated end to end without hardware.

Simulation Mode

The whole product, with no chamber attached.

The trial boots a virtual Watlow F4T and runs it for real — the demo profile above ramped and recovered on its own. It is not a canned demo: the virtual controller answers Modbus on loopback, so the application connects, polls, reads and writes exactly as it does against hardware. Simulated records are kept out of the regulated audit trail, and the trail records when simulation ran.

Proves the software can be evaluated end to end without hardware

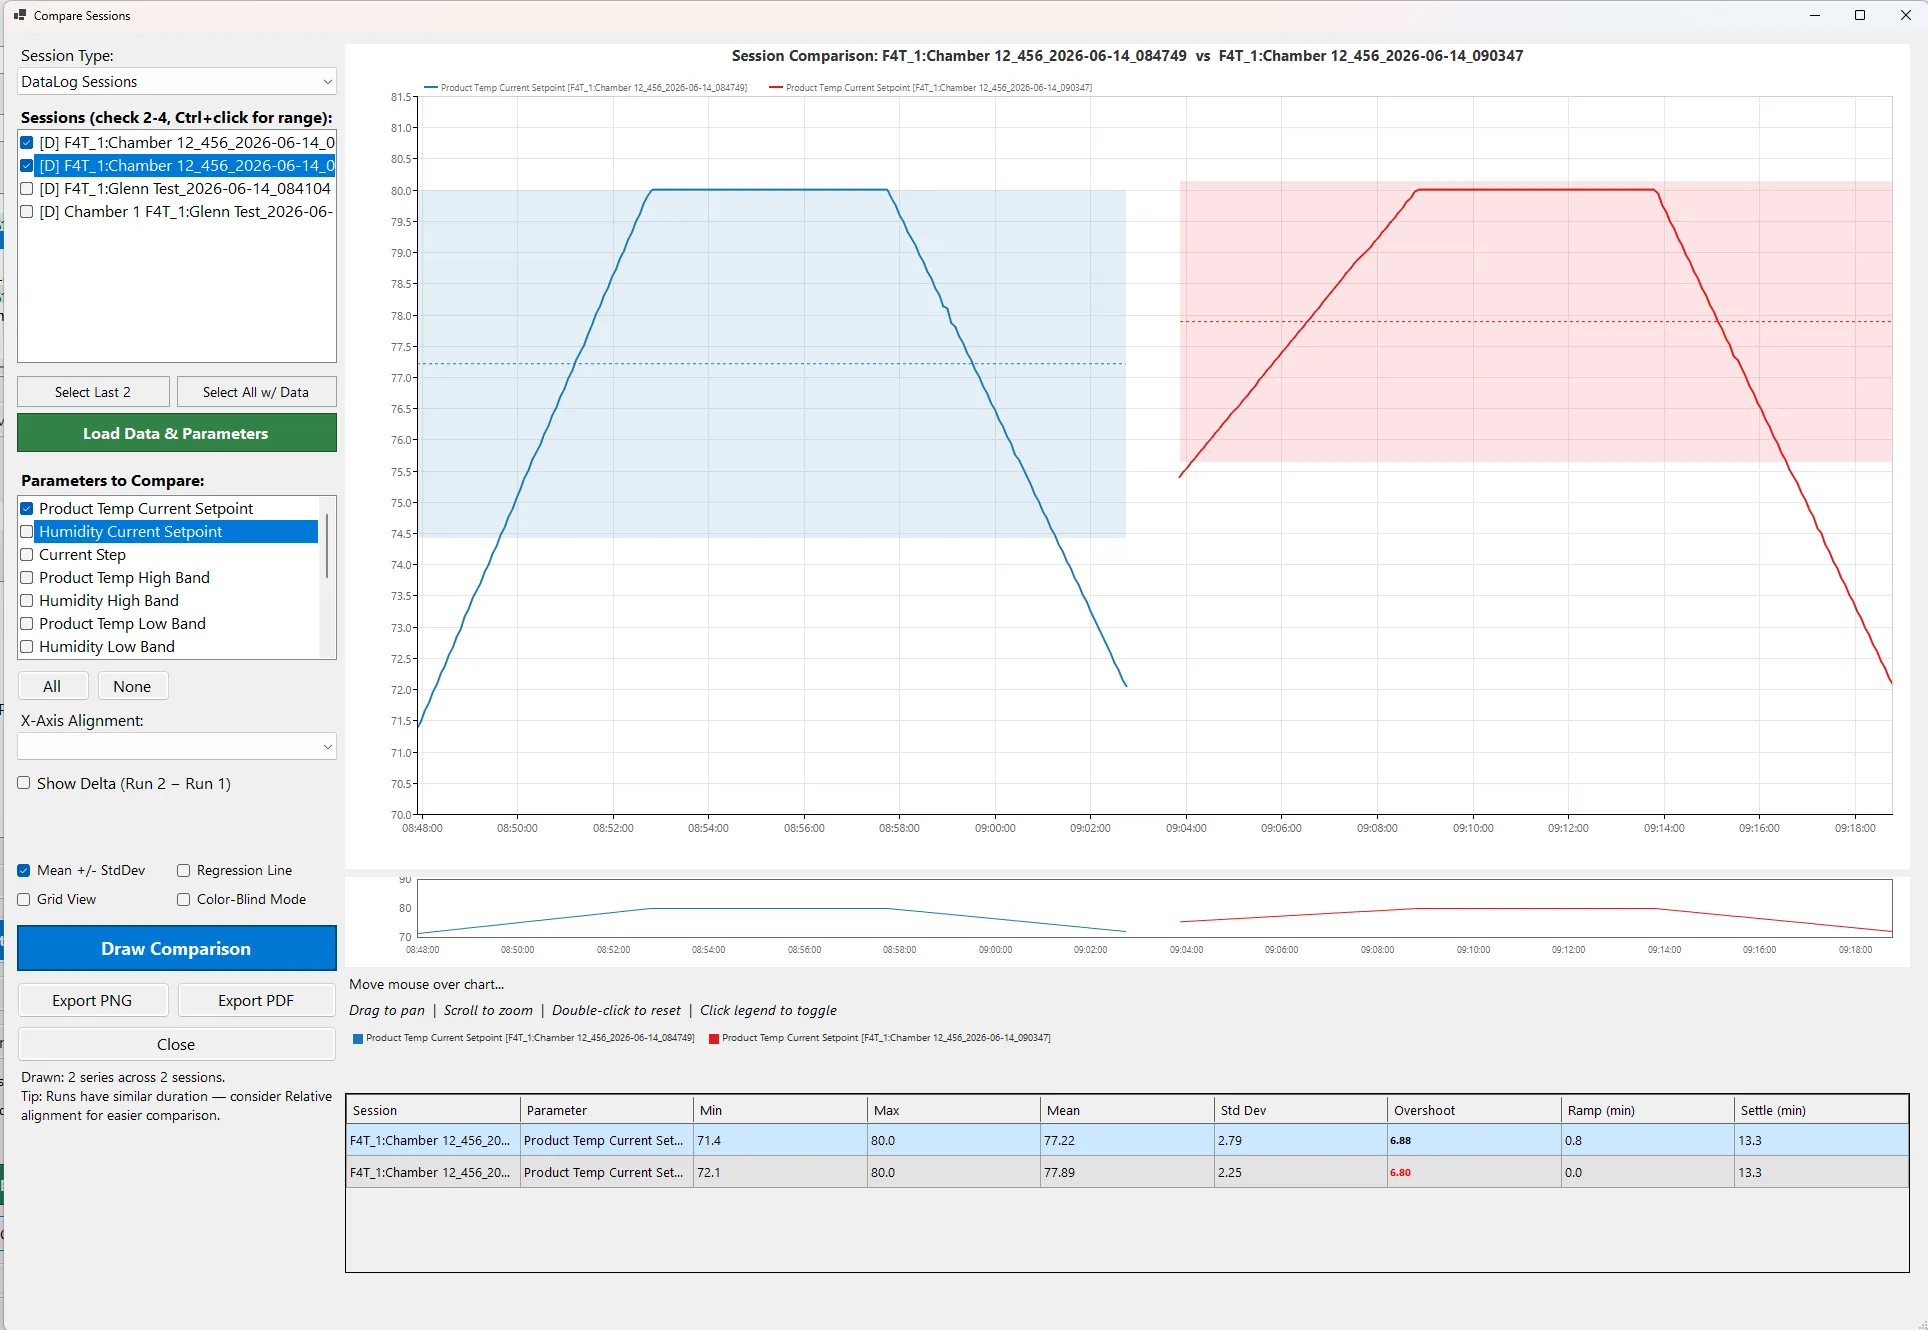
Screenshot showing that drift is visible before it becomes a failure.

Run history

This run against the ones before it.

Overlay a run on its history to see drift before it becomes a deviation. Every archived run stays queryable in the local database, so the comparison is against your own record.

Proves drift is visible before it becomes a failure

Architecture

Written once.
Yours everywhere.

ProcessView+ writes every sample to a SQLite database on your own machine, and everything downstream reads from that one record. No third-party hosting, no nightly export.

Chamber network

Up to 25 controllers · Modbus TCP / RTU

  • MQTT telemetry Chamber state publishes over MQTT v5 to a broker you run, with optional TLS 1.2 and certificate pinning. Controllers publish in rotation, one every two seconds.

The record

A database on your machine

SQLite · written once per sample · integrity hash-chained

  • Microsoft SQL Server Sessions, statistics, SAT and calibration records mirrored into SQL Server or Azure SQL, driven off the local database. No exports, no nightly job.
  • QA reports PASS / REVIEW / FAIL PDFs with tolerance bands and per-step statistics, plus CSV.
  • Audit trail A separate hash-chained store on the same machine, with AES-256-GCM record content and signatures bound to the exact record signed.

Industries

Built for regulated and quality-driven teams

Pharma & stability

  • MKT per channel, on the QA report cover
  • Joint temperature / humidity window per condition
  • Every excursion and every outage accounted for

Try it: Stability Demo · 25 °C / 60 %RH

Environmental & reliability test

  • Setpoint-pair dwell at each test condition
  • Dew point for condensation risk
  • Time in tolerance, step by step

Try it: 85/85 Steady State · 85 °C / 85 %RH

Aerospace heat treat

  • AMS 2750 survey table per soak
  • Thermocouple spread over time
  • Per-sensor survey detail and work-zone map

Try it: TUS Demo · Class 2 survey at 250 °F

For your IT team

Your architecture, your choice

ProcessView+ mirrors live process data to your existing Microsoft SQL Server in real time. No exports, no nightly batch jobs, no third-party data hosting required. Your BI, reporting, and analytics tools see chamber data the moment it is recorded.

For cloud-first environments, the same data streams over MQTT to a self-hosted broker, which you can run on AWS or Azure.

SQL ServerAzure SQLMQTTWeb & mobile dashboards

Technical specifications

ControllersWatlow® F4T, F4, EZ-Zone® PM, Future Design® MCT4
CapacityUp to 25 networked controllers
NetworkingModbus TCP/IP, RTU, STD BUS gateway
Operating systemWindows 10, 11
External databasesMicrosoft SQL Server, Azure SQL
Cloud & IoTMQTT v5 to your own broker, with optional TLS 1.2 and certificate pinning; web and mobile dashboards
Compliance21 CFR Part 11, AMS 2750, audit trail, e-signatures

Run a stability chamber demo in about 10 minutes.

The free trial includes four demonstrations on a built-in controller simulator: a stability chamber, an 85/85 damp-heat test, a temperature/humidity cycle and a furnace survey. Each ends in a judged run and a QA report. At the 4× demo clock the stability run takes about 10 minutes. No hardware needed.